Dear Dr. Jay: Bayesian Networks

Posted by Dr. Jay Weiner

Thu, Jul 30, 2015

Hello Dr. Jay,

I enjoyed your recent post on predictive analytics that mentioned Bayesian Networks.

Could you explain Bayesian Networks in the context of survey research? I believe a Bayes Net says something about probability distribution for a given data set, but I am curious about how we can use Bayesian Networks to prioritize drivers, e.g. drivers of NPS or drivers of a customer satisfaction metric.

-Al

Dear Dr. Jay, Chadwick Martin BaileyDear Al,

Driver modeling is an interesting challenge. There are 2 possible reasons why folks do driver modeling. The first is to prioritize a set of attributes that a company might address to improve a key metric (like NPS). In this case, a simple importance ranking is all you need. The second reason is to determine the incremental change in your dependent variable (DV) as you improve any given independent variable by X. In this case, we’re looking for a set of coefficients that can be used to predict the dependent variable.

Why do I distinguish between these two things? Much of our customer experience and brand ratings work is confounded by multi-collinearity. What often happens in driver modeling is that 2 attributes that are highly correlated with each other might end up with 2 very different scores—one highly positive and the other 0, or worse yet, negative. In the case of getting a model to accurately predict the DV, I really don’t care about the magnitude of the coefficient or even the sign. I just need a robust equation to predict the value. In fact, this is seldom the case. Most clients would want these highly correlated attributes to yield the same importance score.

So, if we’re not interested in an equation to predict our DV, but do want importances, Bayes Nets can be a useful tool. There are a variety of useful outputs that come from Bayes Nets. Mutual information and Node Force are two such items. Mutual information is essentially the reduction in uncertainty about one variable given what we know about the value of another. We can think of Node Force as a correlation between any 2 items in the network. The more certain the relationship (higher correlation), the greater the Node Force.

The one thing that is relatively unique to Bayes Nets is the ability to see if the attributes are directly connected to your key measure or if they are moderated through another attribute. This information is often useful in understanding possible changes to other measures in the network. So, if the main goal is to help your client understand the structure in your data and what items are most important, Bayes Nets is quite useful.

Got a burning research question? You can send your questions to DearDrJay@cmbinfo.com or submit anonymously here.

Dr. Jay Weiner is CMB’s senior methodologist and VP of Advanced Analytics. Jay earned his Ph.D. in Marketing/Research from the University of Texas at Arlington and regularly publishes and presents on topics, including conjoint, choice, and pricing.

Topics: Advanced Analytics, NPS, Dear Dr. Jay

The Power of Kaleidoscope Thinking

Posted by Anne Bailey Berman

Mon, Jul 27, 2015

KaleidoscopeI can’t count the number of presentations and lectures I’ve attended throughout my professional career. While many have contained grains of useful insight, few have remained as relevant as one I attended by Harvard professor Rosabeth Moss Kanter. In that presentation, she argued that we should practice “kaleidoscope thinking.” I’ve always loved that idea—"look at all of your assets, move them around, and see if they create new opportunities." While Kanter was talking about marketing, I’d argue that today those of us in the information and insights business must practice this type of thinking more than ever.

To me, kaleidoscope thinking describes how we should approach information to reveal insights that are useful for our clients. Regardless of the volume and sources of information (e.g., characteristics, behaviors, beliefs, satisfaction, intention, and experiences), much of what we are trying to do is understand the patterns that will influence behaviors. In our information world, we call this analysis.

The sheer vastness of available data can be paralyzing or—worse—lead to catastrophic decision-making. We need to put the right information in our “kaleidoscopes” and view the data and decisions in different ways. By thoughtfully turning the barrel, we can see all the different decision paths until we uncover those that are best for increasing opportunity and decreasing risk. It is critical that we develop the skills to see and understand the most useful patterns and insights—not necessarily the solutions that first appear. This is what provides the most beautiful (read: useful) image in the kaleidoscope. 

Anne is the President of Chadwick Martin Bailey and a collector of kaleidoscopes. This summer, she can be found lecturing on storytelling in the insights industry.  

Watch our recent webinar to hear the results of our self-funded Consumer Pulse study on the future of the mobile wallet. 

Watch Here!

Topics: Business Decisions, Consumer Insights

Embracing Mobile Market Research

Posted by Brian Jones

Thu, Jul 23, 2015

Who are the mobile consumers?

mobile research, cmbLet’s get this straight: I am not addicted to my smartphone. Unlike so many of my fellow train commuters who stare zombie-eyed into their small screens, I am not immersed in a personal relationship with pixels. I have an e-Reader for that. But, my smartphone IS my lifeline.I’ve come to depend exclusively on my phone to keep me on-time and on-schedule, to entertain me (when not using my e-Reader), to stay in touch with family and friends, and to keep up-to-date with my work email. It’s my primary source for directions, weather, news, photography, messaging, banking, and a regular source for payment, shopping, and ticketing/reservations. I haven’t purchased a PC in nearly a decade, and I don’t have a landline. I also use my smartphone to take market research questionnaires, and I am far from alone. 

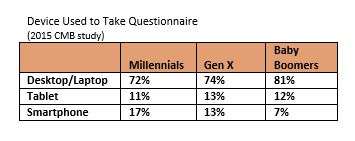
Data around smartphone usage aligns with my personal experience. In a recent CMB online study of U.S. consumers, optimized for mobile devices, 1 in 6 Millennials completed the questionnaire on a smartphone. Other studies report similar results. This example illustrates the issue with representativeness. Major panel vendors are seeing over half of Millennials joining their panels via a mobile device. 

mobile research, cmb

How do we adapt?

Much has been hypothesized about the future of market research under the new paradigm of mobile commerce, big data, and cloud services. New technologies and industry convergence (not just mobile) have brought sweeping changes in consumer behaviors, and market researchers must adapt.

A key component of successful adaptation will be greater integration of primary market research with other data streams. The promise of passive or observational data is captivating, but it is largely still in the formative stages. (For more on passive data, check out our recent webinar.) We still need and will likely always need active “please tell me” research. The shift from phone to online data collection has quickly been replaced with the urgency of a shift to mobile data collection (or at least device agnostic interviewing). Our industry has lagged behind because the consumer experience has become so personalized and the trust/value equation for tapping into their experiences is challenging. Tackling mobile market research with tactical solutions is a necessary step in this transition.

What should we do about it?  

  1. Understand your current audience. Researchers need to determine how important mobile data collection is to the business decision and decide how to treat mobile respondents. You can have all respondents use a mobile device, have some use a mobile device, or have mobile device respondents excluded. There are criteria and considerations for each of these, and there are also considerations for the expected mix of feature phones, smartphones, tablets, and PCs. The audience will determine the source of sample and representation that must be factored into the study design. Ultimately, this has a huge impact on the validity and reliability of the data. Respondent invitations need to include any limitations for devices not suitable for a particular survey.
  2. Design for mobile. If mobile participation is important, researchers should use a mobile first questionnaire design. Mobile optimized or mobile friendly surveys typically need to be shorter in length, use concise language, avoid complex grids and answering mechanisms, and have fewer answer options, so they can be supported on a small screen and keep respondents focused on the activity. In some cases,questionnaire modularization or data stitching can be used to help adhere to mobile design standards.
  3. Test for mobile. All questions, images, etc. need to display on a variety of screen sizes and within the bandwidth capacity of the devices that are being used. Android and iOS device accommodation covers most users. If app based surveys are being used, researchers need to ensure that the latest versions can be downloaded and are bug-free. 
  4. Apply data protection and privacy standards. Mobile market research comes with a unique set of conditions and challenges that impact how information is collected, protected, and secured. Research quality and ethical guidelines specific to mobile market research have been published by CASRO, ESOMAR, the MMRA (Mobile Marketing Research Association), and others.
  5. Implement Mobile Qualitative. The barriers are lower, and researchers can leverage the unique capabilities of mobile devices quite effectively with qualitative research. Most importantly, willing participants are mobile, which makes in-the-moment research possible. Mobile qualitative is also a great gateway to explore what’s possible for mobile quantitative studies. See my colleague Anne Hooper’s blog for more on the future of qualitative methodologies.
  6. Promote Research-on-Research. Experts need to conduct and publish additional research-on-research studies that advance understanding of how to treat mobile respondents and utilize passive data, location tracking, and other capabilities that mobile devices provide. We also need stronger evidence of what works and what doesn’t work in execution of multi-mode and mobile-only studies across different demographics, in B2B studies, and within different countries.

But perhaps the most important thing to remember is that this is just a start. Market researchers and other insight professionals must evolve from data providers to become integrated strategic partners—harnessing technology (not just mobile) to industry expertise to focus on decision-making, risk reduction, and growth.

Brian is a Senior Project Manager for Chadwick Martin Bailey, the photographer of the image in this post, and an 82 percenter—he is one of the 82% of mobile phone owners whose phone is with them always or most of the time. 

Watch our recent webinar that discusses the results of our self-funded Consumer Pulse study on the future of the mobile wallet. 

Watch Here!

Topics: Methodology, Qualitative Research, Mobile, Research Design

Mobile Passive Behavioral Data: Opportunities and Pitfalls

Posted by Chris Neal

Tue, Jul 21, 2015

By Chris Neal and Dr. Jay Weiner

Hands with phonesAs I wrote in last week’s post, we recently conducted an analysis of mobile wallet use in the U.S. To make it interesting, we used unlinked passive mobile behavioral data alongside survey-based data.In this post, I’ve teamed up with Jay Weiner—our VP of Analytics who helped me torture analyze the mobile passive behavioral data for this Mobile Wallet study—to share some of the typical challenges you may face when working with passive mobile behavioral data (or any type of passive behavioral data for that matter) along with some best practices for dealing with these challenges:

  1. Not being able to link mobile usage to individualsThere’s a lot of online passive data out there (mobile app usage ratings, web usage ratings by device type, social media monitoring, etc.) that is at the aggregate level and cannot be reliably attributed to individuals. These data have value, to be sure, but aggregate traffic data can sometimes be very misleading. This is why—for the Mobile Wallet project CMB did—we sourced mobile app and mobile web usage from the Research Now mobile panel where it is possible to attribute mobile usage data to individuals (and have additional profiling information on these individuals). 

    When you’re faced with aggregate level data that isn’t linked to individuals, we recommend either getting some sample from a mobile usage panel in order to understand and calibrate your results better and/or doing a parallel survey-sampling so you can make more informed assumptions (this holds true for aggregate search trend data, website clickstream data, and social media listening tools).
  1. Unstacking the passive mobile behavioral data. Mobile behavioral data that is linked to individuals typically comes in “stacked” form, i.e., every consumer tracked has many different records: one for each active mobile app or mobile website session. Analyzing this data in its raw form is very useful for understanding overall mobile usage trends. What these stacked behavioral data files do not tell you, however, is the reach or incidence (e.g., how many people or the percentage of an addressable market) of any given mobile app/website. It also doesn’t tell you the mobile session frequency or duration characteristics of different consumer types nor does it allow you to profile types of people with different mobile behaviors. 

    Unstacking a mobile behavioral data file can sometimes end up being a pretty big programming task, so we recommend deciding upfront exactly which apps/websites you want to “unstack.” A typical behavioral data file that tracks all smartphone usage during a given period of time can involve thousands of different apps and websites. . .and the resulting unstacked data file covering all of these could quickly become unwieldy.
  1. Beware the outlier! Unstacking a mobile behavioral data file will reveal some pretty extreme outliers. We all know about outliers, right? In survey research, we scrub (or impute) open-ended quant responses that are three standard deviations higher than the mean response, we take out some records altogether if they claim to be planning to spend $6 billion on their next smartphone purchase, and so on. But outliers in passive data can be quite extreme. In reviewing the passive data for this particular project, I couldn’t help but recall that delightful Adobe Marketing ad in which a baby playing with his parents’ tablet repeatedly clicks the “buy” button for an encyclopedia company’s e-commerce site, setting off a global stock bubble. 

    Here is a real-world example from our mobile wallet study that illustrates just how wide the range is of mobile behaviors across even a limited group of consumers: the overall “average” time spent using a mobile wallet app was 162 minutes, but the median time was only 23 minutes. A very small (<1% of total) portion of high-usage individuals created an average that grossly inflated the true usage snapshot of the majority of users. One individual spent over 3,000 minutes using a mobile wallet app.
  1. Understand what is (and what is not) captured by a tracking platform. Different tracking tools do different things and produce different data to analyze. In general, it’s very difficult to capture detailed on-device usage for iOS devices. . .most platforms set up a proxy that instead captures and categorizes the IP addresses that the device transmits data to/from. In our Mobile Wallet study, as one example, our mobile behavioral data did not pick up any Apple Pay usage because it leverages NFC to conduct the transaction between the smartphone and the NFC terminal at the cash register (without any signal ever being transmitted out to the mobile web or to any external mobile app, which is how the platform captured mobile usage).   There are a variety of tricks of the trade to account for these phenomenon and to adjust your analysis so you can get close to a real comparison, but you need to understand what things aren’t picked up by passive metering in order to apply them correctly.
  1. Categorize apps and websites. Needless to say, there are many different mobile apps and websites that people use, and many of these do a variety of different things and are used for a variety of different purposes. Additionally, the distribution of usage across many niche apps and websites is often not useful for any meaningful insights work unless these are bundled up into broader categories. 

    Some panel sources—including Research Now’s mobile panel—have existing mobile website and app categories, which are quite useful. For many custom projects, however, you’ll need to do the background research ahead of time in order to have meaningful categories to work with. Fishing expeditions are typically not a great analysis plan in any scenario, but they are out of the question if you’re going to dive into a big mobile usage data file.

    As you work to create meaningful categories for analysis, be open to adjusting and iterating. A certain group of specific apps might not yield the insight you were looking for. . .learn from the data you see during this process then try new groupings of apps and websites accordingly.
  1. Consider complementary survey sampling in parallel with behavioral analysis. During our iterative process of attempting to categorize mobile apps from reviewing passive mobile behavioral data, we were relieved to have a complementary survey sampling data set that helped us make some very educated guesses about how or why people were using different apps. For example, PayPal has a very successful mobile app that is widely used for a variety of reasons—peer-to-peer payments, ecommerce payments, and, increasingly, for “mobile wallet” payments at a physical point of sale. The passive behavioral data we had could not tell us what proportion of different users’ PayPal mobile app usage was for which purpose. That’s a problem because if we were relying on passive data alone to tell our clients what percent of smartphone users have used a mobile wallet to pay at a physical point of sale, we could come up with grossly inflated numbers. As an increasing number of mobile platforms add competing functionality (e.g., Facebook now has mobile payments functionality), this will remain a challenge.

    Passive tracking platforms will no doubt crack some of these challenges accurately, but some well-designed complementary survey sampling can go a long way towards helping you read the behavioral tea leaves with greater confidence. It can also reveal differences between actual vs. self-reported behavior that are valuable for businesses (e.g., a lot of people may say they really want a particular mobile functionality when asked directly, but if virtually no one is actually using existing apps that provide this functionality then perhaps your product roadmap can live without it for the next launch).

Want to learn more about the future of Mobile Wallet? Join us for a webinar on August 19, and we’ll share our insights with you!

Chris Neal leads CMB’s Tech Practice. He judges every survey he takes and every website he visits by how it looks on his 4” smartphone screen, and has sworn off buying a larger “phablet” screen size because it wouldn’t fit well in his Hipster-compliant skinny jeans.

Dr. Jay heads up the analytics group at CMB. He opted for the 6 inch “phablet” and baggy jeans.  He does look stupid talking to a brick. He’s busy trying to compute which event has the higher probability: his kids texting him back or his kids completing an online questionnaire. Every month, he answers your burning market research questions in his column: Dear Dr. Jay. Got a question? Ask it here!

Want to learn more about combining survey data with passive mobile behavioral data? Watch our recent webinar with Research Now that discusses these findings in depth.

Watch Now!

Topics: Advanced Analytics, Methodology, Data Collection, Mobile, Dear Dr. Jay, Webinar, Passive Data

Upcoming Webinar: Passive Mobile Behavioral Data + Survey Data

Posted by Chris Neal

Mon, Jul 13, 2015

mobile research, mobile data collection, The explosion of mobile web and mobile app usage presents enormous opportunities for consumer insights professionals to deepen their understanding of consumer behavior, particularly for “in the moment” findings and tracking consumers over time (when they aren’t actively participating in research. . .which is 99%+ of the time for most people). Insight nerds like us can’t ignore this burgeoning wealth of data—it is a potential goldmine. But, working with passive mobile behavioral data brings with it plenty of challenges, too. It looks, smells, and feels very different from self-reported survey data:

  • It’s big. (I’m not gonna drop the “Big Data” buzzword in this blog post, but—yep—the typical consumer does indeed use their smartphone quite a bit.)
  • It’s messy.
  • We don’t have the luxury of carefully curating it in the same way we do with survey sampling. 

As we all find ourselves increasingly tasked with synthesizing insights and a cohesive “story” using multiple data sources, we’re finding that mobile usage and other data sources don’t always play nicely in the sandbox with survey data. Each of them have their strengths and weaknesses that we need to understand in order to use them most effectively. 

So, in our latest in a series of sadomasochistic self-funded thought leadership experiments, we decided to take on a challenge similar in nature to what more and more companies will ask insights departments to do: use passive mobile behavioral data alongside survey-based data for a single purpose. In this case, the topic was an analysis of the U.S. mobile wallet market opportunity. To make things extra fun, we ensured that the passive mobile behavioral data was completely unlinked to the survey data (i.e., we could not link the two data sources at the respondent level for deeper understanding or to do attitudinal + behavioral based modeling). There are situations where you’ll be given data that is linked, but currently—more often than not—you’ll be working with separate silos and asked to make hay.

During this experiment, a number of things became very clear to us, including:

  • the actual value that mobile behavioral data can bring to business engagements
  • how it could easily produce misleading results if you don’t properly analyze the data
  • how survey data and passive mobile behavioral data can complement one another greatly

Interested? I’ll be diving deep into these findings (and more) along with Roddy Knowles of Research Now in a webinar this Thursday, July 16th at 1pm ET (11am PT). Please join us by registering here

Chris leads CMB’s Tech Practice. He enjoys spending time with his two kids and rock climbing.

Watch our recent webinar with Research Now to hear the results of our recent self-funded Consumer Pulse study that leveraged passive mobile behavioral data and survey data simultaneously to reveal insights into the current Mobile Wallet industry in the US.

Watch Now!

Topics: Advanced Analytics, Methodology, Data Collection, Mobile, Webinar, Passive Data, Integrated Data