Dear Dr. Jay: Can One Metric Rule Them All?

Posted by Dr. Jay Weiner

Wed, Dec 16, 2015

Hi Dr. Jay –

The city of Boston is trying develop one key measure to help officials track and report how well the city is doing. We’d like to do that in house. How would we go about it?

-Olivia


DrJay_desk-withGoatee.pngHi Olivia,

This is the perfect tie in for big data and the key performance index (KPI). Senior management doesn’t really have time to pour through tables of numbers to see how things are going. What they want is a nice barometer that can be used to summarize overall performance. So, how might one take data from each business unit and aggregate them into a composite score?

We begin the process by understanding all the measures we have. Once we have assembled all of the potential inputs to our key measure, we need to develop a weighting system to aggregate them into one measure. This is often the challenge when working with internal data. We need some key business metric to use as the dependent variable, and these data are often missing in the database.

For example, I might have sales by product by customer and maybe even total revenue. Companies often assume that the top revenue clients are the bread and butter for the company. But what if your number one account uses way more corporate resources than any other account? If you’re one of the lucky service companies, you probably charge hours to specific accounts and can easily determine the total cost of servicing each client. If you sell a tangible product, that may be more challenging. Instead of sales by product or total revenue, your business decision metric should be the total cost of doing business with the client or the net profit for each client. It’s unlikely that you capture this data, so let’s figure out how to compute it. Gross profit is easy (net sales – cost of goods sold), but what about other costs like sales calls, customer service calls, and product returns? Look at other internal databases and pull information on how many times your sales reps visited in person or called over the phone, and get an average cost for each of these activities. Then, you can subtract those costs from the gross profit number. Okay, that was an easy one.

Let’s look at the city of Boston case for a little more challenging exercise. What types of information is the city using? According to the article you referenced, the city hopes to “corral their data on issues like crime, housing for veterans and Wi-Fi availability and turn them into a single numerical score intended to reflect the city’s overall performance.” So, how do you do that? Let’s consider that some of these things have both income and expense implications. For example, as crime rates go up, the attractiveness of the city drops and it loses residents (income and property tax revenues drop). Adding to the lost revenue, the city has the added cost of providing public safety services. If you add up the net gains/losses from each measure, you would have a possible weighting matrix to aggregate all of the measures into a single score. This allows the mayor to quickly assess changes in how well the city is doing on an ongoing basis. The weights can be used by the resource planners to assess where future investments will offer the greatest pay back.

 Dr. Jay is fascinated by all things data. Your data, our data, he doesn’t care what the source. The more data, the happier he is.

Topics: Advanced Analytics, Boston, Big Data, Dear Dr. Jay

Dear Dr. Jay: The Internet of Things and The Connected Cow

Posted by Dr. Jay Weiner

Thu, Nov 19, 2015

Hello Dr. Jay, 

What is the internet of things, and how will it change market research?

-Hugo 


DrJay_Thinking-withGoatee_cow.png

Hi Hugo,

The internet of things is all of the connected devices that exist. Traditionally, it was limited to PCs, tablets, and smartphones. Now, we’re seeing wearables, connected buildings and homes. . .and even connected cows. (Just when I thought I’d seen it all.) Connected cows, surfing the internet looking for the next greenest pasture. Actually, a number of companies offer connected cow solutions for farmers. Some are geared toward beef cattle, others toward dairy cows. Some devices are worn on the leg or around the neck, others are swallowed (I don’t want to know how you change the battery). You can track the location of the herd, monitor milk production, and model the best field for grass to increase milk output. The solutions offer alerts to the farmer when the cow is sick or in heat, which means that the farmer can get by with fewer hands and doesn’t need to be with each cow 24/7. Not only can the device predict when a cow is in heat, it can also bias the gender of the calf based on the window of opportunity. Early artificial insemination increases the probability of getting a female calf. So, not only can the farmer increase his number of successful inseminations, he/she can also decide if more bulls or milk cows are needed in the herd. 

How did this happen? A bunch of farmers put the devices on the herd and began collecting data. Then, the additional data is appended to the data set (e.g., the time the cow was inseminated, whether it resulted in pregnancy, and the gender of the calf). If enough farmers do this, we can begin to build a robust data set for analysis.

So, what does this mean for humans? Well, many of you already own some sort of fitness band or watch, right? What if a company began to collect all of the data generated by these devices? Think of all the things the company could do with those data! It could predict the locations of more active people. If it appended some key health measures (BMI, diabetes, stroke, death, etc.) to the dataset, the company could try to build a model that predicts a person’s probability of getting diabetes, having a stroke, or even dying. Granted, that’s probably not a message you want from your smart watch: “Good afternoon, Jay. You will be dead in 3 hours 27 minutes and 41 seconds.” Here’s another possible (and less grim) message: “Good afternoon, Jay. You can increase your time on this planet if you walk just another 1,500 steps per day.” Healthcare providers would also be interested in this information. If healthcare providers had enough fitness tracking data, they might be able to compute new lifetime age expectations and offer discounts to customers who maintain a healthy lifestyle (which is tracked on the fitness band/watch).  

Based on connected cows, the possibility of this seems all too real. The question is: will we be willing to share the personal information needed to make this happen? Remember: nobody asked the cow if it wanted to share its rumination information with the boss.

Dr. Jay Weiner is CMB’s senior methodologist and VP of Advanced Analytics. He is completely fascinated and paranoid about the internet of things. Big brother may be watching, and that may not be a good thing.

Topics: Technology, Healthcare Research, Data Collection, Dear Dr. Jay, Internet of Things (IoT), Data Integration

You Cheated—Can Love Restore Trust?

Posted by James Kelley

Mon, Nov 02, 2015

This year has been rife with corporate scandals. For example, FIFA’s corruption case and Volkswagen’s emissions cheating admission may have irreparably damaged public trust for these organizations. These are just two of the major corporations caught this year, and if history tells us anything, we’re likely to see at least another giant fall in 2015. 

What can managers learn about their brands from watching the aftermath of corporate scandal? Let’s start with the importance of trust—something we can all revisit. We take it for granted when our companies or brands are in good standing, but when trust falters, it recovers slowly and impacts all parts of the organization. To prove the latter point, we used data from our recent self-funded Consumer Pulse research to understand the relationship between Likelihood to Recommend (LTR), a Key Performance Indicator, and Trustworthiness amongst a host of other brand attributes. 

Before we dive into the models, let’s talk a little bit about the data. We leveraged data we collected some months ago—not at the height of any corporate scandal. In a perfect world, we would have pre-scandal and post-scandal observations of trust to understand any erosion due to awareness of the deception. This data also doesn’t measure the auto industry or professional sports. It focuses on brands in the hotel, e-commerce, wireless, airline, and credit card industries. Given the breadth of the industries, the data should provide a good look at how trust impacts LTR across different types of organizations. Finally, we used Bayes Net (which we’ve blogged about quite a bit recently) to factor and map the relationships between LTR and brand attributes. After factoring, we used TreeNet to get a more direct measure of explanatory power for each of the factors.

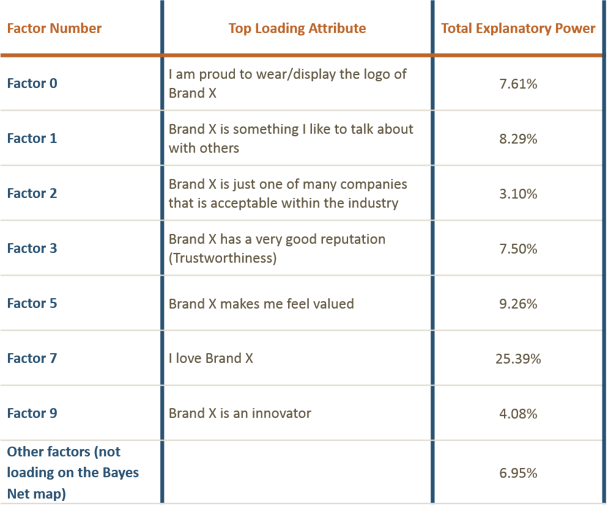
First, let’s take a look at the TreeNet results. Overall, our 31 brand attributes explain about 71% of the variance in LTR—not too shabby. Below are each factors’ individual contribution to the model (summing to 71%). Each factor is labeled by the top loading attribute, although they are each comprised of 3-5 such variables. For a complete list of which attributes goes with which factor, see the Bayes Net map below. That said, this list (labeled by the top attributes) should give you an idea of what’s directly driving LTR:
tree net, cmb, advanced analytics

Looking at these factor scores in isolation, they make inherent sense—love for a brand (which factors with “I am proud to use” and “I recommend, like, or share with friends”) is the top driver of LTR. In fact, this factor is responsible for a third of the variance we can explain. Other factors, including those with trust and “I am proud to wear/display the logo of Brand X” have more modest (and not all that dissimilar) explanatory power. 

You might be wondering: if Trustworthiness doesn’t register at the top of the list for TreeNet, then why is it so important? This is where Bayes Nets come in to play. TreeNet, like regression, looks to measure the direct relationships between independent and dependent variables, holding everything else constant. Bayes Nets, in contrast, looks for the relationships between all the attributes and helps map direct as well as indirect relationships.

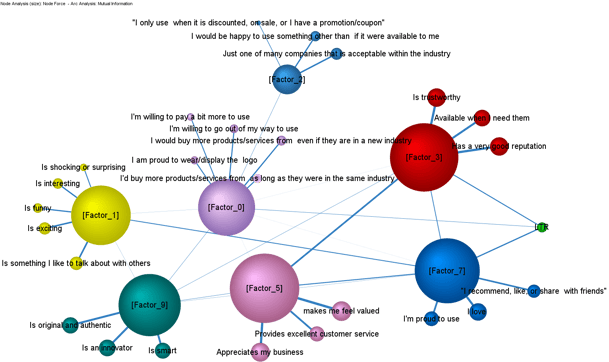
Below is the Bayes Net map for this same data (and you can click on the map to see a larger image). You need three important pieces of information to interpret this data:

  1. The size of the nodes (circles/orbs) represents how important a factor is to the model. The bigger the circle, the more important the factor.
  2. Similarly, the thicker the lines, the stronger a relationship is between two factors/variables. The boldest lines have the strongest relationships.
  3. Finally, we can’t talk about causality, but rather correlations. This means we can’t say Trustworthiness causes LTR to move in a certain direction, but rather that they’re related. And, as anyone who has sat through an introduction to statistics course knows, correlation does not equal causation.
bayes net, cmb, advanced analytics

Here, Factor 7 (“I love Brand X”) is no longer a hands-down winner in terms of explanatory power. Instead, you’ll see that Factors 3, 5, 7 and 9 each wield a great deal of influence in this map in pretty similar quantities. Factor 7, which was responsible for over a third of the explanatory power before, is well-connected in this map. Not surprising—you don’t just love a brand out of nowhere. You love a brand because they value you (Factor 5), they’re innovative (Factor 9), they’re trustworthy (Factor 3), etc. Factor 7’s explanatory power in the TreeNet model was inflated because many attributes interact to produce the feeling of love or pride around a brand.

Similarly, Factor 3 (Trustworthiness) was deflated. The TreeNet model picked up the direct relationship between Trustworthiness and LTR, but it didn’t measure its cumulative impact (a combination of direct and indirect relationships). Note how well-connected Factor 3 is. It’s strongly related (one of the strongest relationships in the map) to Factor 5, which includes “Brand X makes me feel valued,” “Brand X appreciates my business,” and “Brand X provides excellent customer service.” This means these two variables are fairly inseparable. You can’t be trustworthy/have a good reputation without the essentials like excellent customer service and making customers feel valued. Although to a lesser degree, Trustworthiness is also related to love. Business is like dating—you can’t love someone if you don’t trust them first.

The data shows that sometimes relationships aren’t as cut and dry as they appear in classic multivariate techniques. Some things that look important are inflated, while other relationships are masked by indirect pathways. The data also shows that trust can influence a host of other brand attributes and may even be a prerequisite for some. 

So what does this mean for Volkswagen? Clearly, trust is damaged and will need to be repaired.  True to crisis management 101, VW has jettisoned a CEO and will likely make amends to those owners who have been hurt by their indiscretions. But how long will VW feel the damage done by this scandal? For existing customers, the road might be easier. One of us, James, is a current VW owner, and he is smitten with the brand. His particular model (GTI) wasn’t impacted, and while the cheating may damage the value of his car, he’s not selling it anytime soon. For prospects, love has yet to develop and a lack of trust may eliminate the brand from their consideration set.

The takeaway for brands? Don’t take trust for granted. It’s great while you’re in good favor, but trust’s reach is long, varied, and has the potential to impact all of your KPIs. Take a look at your company through the lens of trust. How can you improve? Take steps to better your customer service and to make customers feel valued. It may pay dividends in improving trust, other KPIs, and, ultimately, love.

Dr. Jay Weiner is CMB’s senior methodologist and VP of Advanced Analytics. He keeps buying new cars to try to make the noise on the right side go away.

James Kelley splits his time at CMB as a Project Manager for the Technology/eCommerce team and as a member of the analytics team. He is a self-described data nerd, political junkie, and board game geek. Outside of work, James works on his dissertation in political science which he hopes to complete in 2016.

Topics: Advanced Analytics, Data Collection, Dear Dr. Jay, Data Integration, Customer Experience & Loyalty

Dear Dr. Jay: How Long Will My Segmentation Last?

Posted by Jay Weiner, PhD

Tue, Sep 29, 2015

Hi Dr. Jay,

How many segments should we have in an optimal solution, and how long can I expect my segmentation solution to last?

-Katie M.


Hi Katie,

Dear Dr. Jay, CMB, SegmentationYou’re not the only one who’s been asking about segmentation lately. Here’s my philosophy: you should always have at least one more segment than you intend to target. Why? An extra segment gives you the chance to identify an opportunity that you left in the market for your competitors. The car industry is a good example. If you’re old (like me), you remember GM’s product line in the 70s and 80s: “gas-guzzling land yachts.” Had GM bothered to segment the market, it might have identified a growing segment of consumers that were interested in more fuel efficient cars. Remember: just because you have a segment, doesn’t mean you have to target that segment. GM probably didn’t see this particular segment as viable until Toyota, Datsun (now Nissan), and Honda shipped small economy cars in greater numbers to the U.S. market. By that time, GM had shown up too late to the party with a competitive response.

As for how long a segmentation solution lasts? Segmentation schemes typically last as long as there are no major changes in the market. Why? Because segmentation requires strategic research that affects the full spectrum of marketing activities, including all 4 P’s of marketing (product, price, promotion, and place/distribution). One of the greatest catalysts for change comes from technological innovations. In the case of the car industry, those innovations include hybrid, electric, and driverless cars, as well as new competitors, like Tesla and Google. Tesla stands to change the market around distribution because its distribution strategy is unlike any other auto manufacturer. Many of its locations are in or near major shopping malls—not along the traditional auto mile where most dealers compete. While we often see other manufacturers display vehicles in the mall, potential customers would still have to go to a dealer’s lot to actually make a purchase, but Tesla removes this obstacle. This makes Telsa visible to potential customers who are not necessarily looking to purchase a car—a segment many traditional companies ignore.

Remember, segmentations are powerful tools—they can help your product development team generate products that appeal to your target segments, allow you to create stronger demand, and charge higher prices—but they won’t last forever.

Dr. Jay Weiner is CMB’s senior methodologist and VP of Advanced Analytics. Jay earned his Ph.D. in Marketing/Research from the University of Texas at Arlington and regularly publishes and presents on topics including conjoint, choice, and pricing.

Got a burning research question? You can send your questions to DearDrJay@cmbinfo.com or submit anonymously here.

Want to learn more about segmentation?

Learn About Our Approach 

Topics: Product Development, Dear Dr. Jay, Market Strategy & Segmentation

Dear Dr. Jay: Data Integration

Posted by Jay Weiner, PhD

Wed, Aug 26, 2015

Dear Dr. Jay,

How can I explain the value of data integration to my CMO and other non-research folks?

- Jeff B. 


DRJAY-3

Hi Jeff,

Years ago, at a former employer that will remain unnamed, we used to entertain ourselves by playing Buzzword Bingo in meetings. We’d create Bingo cards with 30 or so words that management like to use (“actionable,” for instance). You’d be surprised how fast you could fill a card. If you have attended a conference in the past few years, you know we as market researchers have plenty of new words to play with. Think: big data, integrated data, passive data collection, etc. What do all these new buzzwords really mean to the research community? It boils down to this: we potentially have more data to analyze, and the data might come from multiple sources.

If you only collect primary survey data, then you typically only worry about sample reliability, measurement error, construct validity, and non-response bias. However, with multiple sources of data, we need to worry about all of that plus level of aggregation, impact of missing data, and the accuracy of the data. When we typically get a database of information to append to survey data, we often don’t question the contents of that file. . . but maybe we should.

A client recently sent me a file with more than 100,000 records (ding ding, “big data”). Included in the file were survey data from a number of ad hoc studies conducted over the past two years as well as customer behavioral data (ding ding, “passive data”). And, it was all in one file (ding ding, “integrated data”). BINGO!

I was excited to get this file for a couple of reasons. One, I love to play with really big data sets, and two, I was able to start playing right away. Most of the time, clients send me a bunch of files, and I have to do the integration/merging myself. Because this file was already integrated, I didn’t need to worry about having unique and matching record identifiers in each file.

Why would a client have already integrated these data? Well, if you can add variables to your database and append attitudinal measures, you can improve the value of the modeling you can do. For example, let’s say that I have a Dunkin’ Donuts (DD) rewards card, and every weekday, I stop by a DD close to my office and pick up a large coffee and an apple fritter. I’ve been doing this for quite some time, so the database modelers feel fairly confident that they can compute my lifetime value from this pattern of transactions. However, if the coffee was cold, the fritter was stale, and the server was rude during my most recent transaction, I might decide that McDonald’s coffee is a suitable substitute and stop visiting my local DD store in favor of McDonald’s. How many days without a transaction will it take the DD algorithm to decide that my lifetime value is now $0.00? If we had the ability to append customer experience survey data to the transaction database, maybe the model could be improved to more quickly adapt. Maybe even after 5 days without a purchase, it might send a coupon in an attempt to lure me back, but I digress.

Earlier, I suggested that maybe we should question the contents of the database. When the client sent me the file of 100,000 records, I’m pretty sure that was most (if not all) of the records that had both survey and behavioral measures. Considering the client has millions of account holders, that’s actually a sparse amount of data. Here’s another thing to consider: how well do the two data sources line up in time? Even if 100% of my customer records included overall satisfaction with my company, these data may not be as useful as you might think. For example, overall satisfaction in 2010 and behavior in 2015 may not produce a good model. What if some of the behavioral measures were missing values? If a customer recently signed up for an account, then his/her 90-day behavioral data elements won’t get populated for some time. This means that I would need to either remove these respondents from my file or build unique models for new customers.

The good news is that there is almost always some value to be gained in doing these sorts of analysis. As long as we’re cognizant of the quality of our data, we should be safe in applying the insights.

Got a burning market research question?

Email us! OR Submit anonymously!

Dr. Jay Weiner is CMB’s senior methodologist and VP of Advanced Analytics. Jay earned his Ph.D. in Marketing/Research from the University of Texas at Arlington and regularly publishes and presents on topics, including conjoint, choice, and pricing.

Topics: Advanced Analytics, Big Data, Dear Dr. Jay, Data Integration, Passive Data