This year has been rife with corporate scandals. For example, FIFA’s corruption case and Volkswagen’s emissions cheating admission may have irreparably damaged public trust for these organizations. These are just two of the major corporations caught this year, and if history tells us anything, we’re likely to see at least another giant fall in 2015.
What can managers learn about their brands from watching the aftermath of corporate scandal? Let’s start with the importance of trust—something we can all revisit. We take it for granted when our companies or brands are in good standing, but when trust falters, it recovers slowly and impacts all parts of the organization. To prove the latter point, we used data from our recent self-funded Consumer Pulse research to understand the relationship between Likelihood to Recommend (LTR), a Key Performance Indicator, and Trustworthiness amongst a host of other brand attributes.
Before we dive into the models, let’s talk a little bit about the data. We leveraged data we collected some months ago—not at the height of any corporate scandal. In a perfect world, we would have pre-scandal and post-scandal observations of trust to understand any erosion due to awareness of the deception. This data also doesn’t measure the auto industry or professional sports. It focuses on brands in the hotel, e-commerce, wireless, airline, and credit card industries. Given the breadth of the industries, the data should provide a good look at how trust impacts LTR across different types of organizations. Finally, we used Bayes Net (which we’ve blogged about quite a bit recently) to factor and map the relationships between LTR and brand attributes. After factoring, we used TreeNet to get a more direct measure of explanatory power for each of the factors.
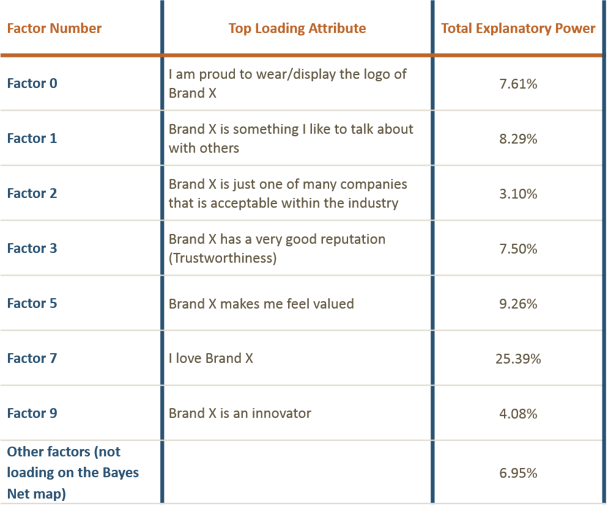
First, let’s take a look at the TreeNet results. Overall, our 31 brand attributes explain about 71% of the variance in LTR—not too shabby. Below are each factors’ individual contribution to the model (summing to 71%). Each factor is labeled by the top loading attribute, although they are each comprised of 3-5 such variables. For a complete list of which attributes goes with which factor, see the Bayes Net map below. That said, this list (labeled by the top attributes) should give you an idea of what’s directly driving LTR:

Looking at these factor scores in isolation, they make inherent sense—love for a brand (which factors with “I am proud to use” and “I recommend, like, or share with friends”) is the top driver of LTR. In fact, this factor is responsible for a third of the variance we can explain. Other factors, including those with trust and “I am proud to wear/display the logo of Brand X” have more modest (and not all that dissimilar) explanatory power.
You might be wondering: if Trustworthiness doesn’t register at the top of the list for TreeNet, then why is it so important? This is where Bayes Nets come in to play. TreeNet, like regression, looks to measure the direct relationships between independent and dependent variables, holding everything else constant. Bayes Nets, in contrast, looks for the relationships between all the attributes and helps map direct as well as indirect relationships.
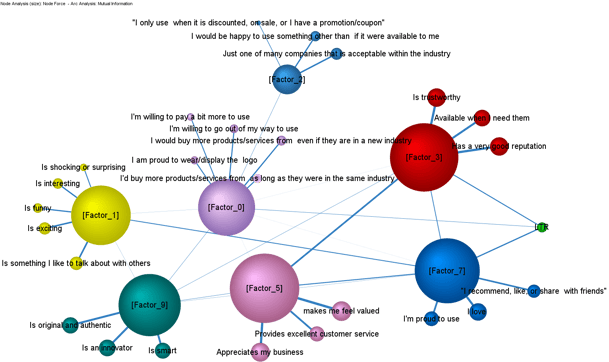
Below is the Bayes Net map for this same data (and you can click on the map to see a larger image). You need three important pieces of information to interpret this data:
- The size of the nodes (circles/orbs) represents how important a factor is to the model. The bigger the circle, the more important the factor.
- Similarly, the thicker the lines, the stronger a relationship is between two factors/variables. The boldest lines have the strongest relationships.
- Finally, we can’t talk about causality, but rather correlations. This means we can’t say Trustworthiness causes LTR to move in a certain direction, but rather that they’re related. And, as anyone who has sat through an introduction to statistics course knows, correlation does not equal causation.

Here, Factor 7 (“I love Brand X”) is no longer a hands-down winner in terms of explanatory power. Instead, you’ll see that Factors 3, 5, 7 and 9 each wield a great deal of influence in this map in pretty similar quantities. Factor 7, which was responsible for over a third of the explanatory power before, is well-connected in this map. Not surprising—you don’t just love a brand out of nowhere. You love a brand because they value you (Factor 5), they’re innovative (Factor 9), they’re trustworthy (Factor 3), etc. Factor 7’s explanatory power in the TreeNet model was inflated because many attributes interact to produce the feeling of love or pride around a brand.
Similarly, Factor 3 (Trustworthiness) was deflated. The TreeNet model picked up the direct relationship between Trustworthiness and LTR, but it didn’t measure its cumulative impact (a combination of direct and indirect relationships). Note how well-connected Factor 3 is. It’s strongly related (one of the strongest relationships in the map) to Factor 5, which includes “Brand X makes me feel valued,” “Brand X appreciates my business,” and “Brand X provides excellent customer service.” This means these two variables are fairly inseparable. You can’t be trustworthy/have a good reputation without the essentials like excellent customer service and making customers feel valued. Although to a lesser degree, Trustworthiness is also related to love. Business is like dating—you can’t love someone if you don’t trust them first.
The data shows that sometimes relationships aren’t as cut and dry as they appear in classic multivariate techniques. Some things that look important are inflated, while other relationships are masked by indirect pathways. The data also shows that trust can influence a host of other brand attributes and may even be a prerequisite for some.
So what does this mean for Volkswagen? Clearly, trust is damaged and will need to be repaired. True to crisis management 101, VW has jettisoned a CEO and will likely make amends to those owners who have been hurt by their indiscretions. But how long will VW feel the damage done by this scandal? For existing customers, the road might be easier. One of us, James, is a current VW owner, and he is smitten with the brand. His particular model (GTI) wasn’t impacted, and while the cheating may damage the value of his car, he’s not selling it anytime soon. For prospects, love has yet to develop and a lack of trust may eliminate the brand from their consideration set.
The takeaway for brands? Don’t take trust for granted. It’s great while you’re in good favor, but trust’s reach is long, varied, and has the potential to impact all of your KPIs. Take a look at your company through the lens of trust. How can you improve? Take steps to better your customer service and to make customers feel valued. It may pay dividends in improving trust, other KPIs, and, ultimately, love.
Dr. Jay Weiner is CMB’s senior methodologist and VP of Advanced Analytics. He keeps buying new cars to try to make the noise on the right side go away.
James Kelley splits his time at CMB as a Project Manager for the Technology/eCommerce team and as a member of the analytics team. He is a self-described data nerd, political junkie, and board game geek. Outside of work, James works on his dissertation in political science which he hopes to complete in 2016.
 We run this blog a little differently than other corporate blogs. Instead of relying on a few resident bloggers, each of our employees writes at least one post a year. This means you get a variety of perspectives, experiences, and opinions on all aspects of market research, analytics, and strategy consulting from insights professionals doing some pretty cool work.

 Hi Olivia,


 Dear Al,