Are You a Wingman to Your CMO?

Posted by Julie Kurd

Mon, Oct 19, 2015

CMB conference recap, market research conferences, corporate researchers conferenceThe traditional military definition of a "wingman" is the second pilot who flies behind and off the right wing of the lead aircraft. The wingman protects the lead by watching his/her back. As I reflected on this year’s MRA Corporate Researchers Conference (CRC) in St. Louis, I thought about my experiences with the wingmen and wingwomen of Chief Marketing Officers at Fortune 500 companies. 

Here’s what separates wingmen and wingwomen from the rest of the pack:

  • They test new stuff ALL THE TIME. Jeffrey Henning moderated a panel with Samsung’s Manvir Kalsi, Chico’s Ivy Boehm, and Lowe’s Celia Van Wickel, asking them to talk about techniques that have disappointed them. They primarily talked about emerging technologies, specifically about vendors who overpromised with facial coding in neuroscience and thematic roll ups that “create themselves” in text analytics. They discussed their “lead pilots” and their companies’ “formation” not having enough time for overly “mathy” insights. They also talked about how they’ve brought dynamic deliverables to their organizations in an attempt to reduce the PowerPoint clutter. Chico’s Ivy Boehm mentioned her quest to shift from 60 page “boring PowerPoints” (her words) to just 20 solid slides through combining information and drawing deeper conclusions. Manvir, Ivy, and Celia also discussed the challenges each of them faces as they make trade-offs in an effort to try new things—even though they know that sometimes all they need are some well-moderated traditional focus groups and a straight up, well-written quantitative survey. This panel proved that no matter the challenge, wingmen are always improving their game.  
  • They play around with working at Mach speed and at a normal pace. Microsoft’s Barry Jennings talked about the company’s Rapid Deployment Programs, which elicit feedback from customers at the later stages of the product development cycle. Successful wingmen are able to adjust and change course quickly—they can’t just head for the horizon. This is the key challenge: knowing when and where to get insights quickly at a lesser cost. At Microsoft, the process is clearly defined: ideation, iteration, validation, repeat. This process helps some concepts fail faster and helps others go to market more quickly. While Microsoft does loads of very methodical research, it’s also pushing itself to be fast and impactful vs perfect. Their program integrates activities, social and independent, moving from ideation to quant to qual and back. They collect feedback across any device and operating system, and they launch research in a day, share results, integrate historic data, and iterate. 
  • They begin with the end in mind and quantify their impact. Terrific researchers understand the business impacts of their research. Roxanne Gray, VP of Research for Wells Fargo, described the diverse household research that supports their “together, we’ll go far” promise. Customer insights played prominently for Wells Fargo as it launched its most recent campaign about the company’s commitment to helping diverse households talk about their finances. Grab a box of tissues, and see more about how Wells Fargo illustrated its 25-year commitment to people with diverse backgrounds. The impact? Roxanne’s research supported confident decision-making that quadrupled earned media. She was energized by the research itself, the executive decisions her stakeholders would make from the research, and the easy-to-digest delivery of insights that she presented as a story, and it showed. 
  • They love what they do, and they stay curious. Wingmen and wingwomen venture out to conferences to present, network, and listen to others. This deep passion for research, learning, and sharing is what keeps us sharp and focused at our organizations. At the best conferences, such as MRA’s CRC, the sheer number of wingmen and the quality of presentations (not to mention the bacon at breakfast) is incredible. If your position as a wingman isn’t rewarded with an adequate budget for this type of travel, have no fear. . . you can check out your local MRA chapter, attend online webinars, talk and listen with your global research peers face-to-face, and connect on Twitter and LinkedIn. 

Let’s keep a line of sight on our lead pilots, the horizon, our formation, and let’s go!

Julie blogs for GreenBook, ResearchAccess, and CMB. She’s an inspired participant, amplifier, socializer, and spotter in the twitter #mrx community, so talk research with her @julie1research.

Our monthly eZine will keep you up-to-date with the latest at CMB and in the market research community!

 Subscribe Here

Topics: Product Development, Storytelling, Business Decisions, Conference Insights

CMB Conference Recap: Hubspot’s INBOUND 2015

Posted by Kirsten Clark

Tue, Sep 15, 2015

Hubspot, INBOUND, marketing, CMB Conference RecapLast week, I attended Hubspot’s INBOUND conference to attend workshops, network with fellow marketers, and hear speakers as diverse as Chelsea Clinton, Aziz Ansari, and Daniel Pink present on topics like disruption, innovation, and how to really connect in an increasingly crowded landscape. Here are just 4 (of many) key takeaways:

1. Adapt to changing SEO. Bill King and Tyler Richer from Hubspot emphasized that keywords continue to lose influence as Google continues to become smarter and smarter. How can you get around this? Start by writing content that’s genuinely useful, and share your content on social media. Sharing it on social media doesn’t directly affect rank, but it does affect distribution (which can affect rank). Finally, remember that there should always be an element of empathy when creating an SEO plan. Searchers have experiences with brands when they search, and you want to make sure every experience with your brand is a great one.

2. Embrace social media ads. They’re here to stay. You might have noticed that Facebook’s organic reach has plummeted. Larry Kim, Founder and CTO of WordStream, pointed out that most of the content people put out on social networks is never seen, and that’s a missed opportunity since 28% of people’s online time is spent on social networks. Social media ads are a highly scalable vehicle for content promotion, so it’s time to embrace the inevitable and boost those posts!

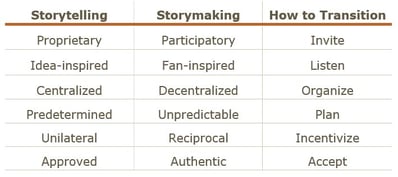
3. Stop storytelling. Start storymaking. David Berkowitz, CMO at MRY, discussed the shift from storytelling to storymaking. The phrase might sound jargony, but semantics aside, what Berkowitz is really asking us to do is make storytelling an interactive experience. Below are some of the differences between storytelling as a monologue and storymaking as an experience:

Hubspot, INBOUND, marketing, CMB Conference Recap, storytelling

To see an example of this in action, look no further than Coca-Cola’s “Share a Coke” campaign. You can find a bottle of Coca-Cola with your name on it in-store or create your own online. This has inspired a plethora of consumer created content, including this pregnancy announcement that has almost 4.5 million views on YouTube.

4. Be brave. During her keynote, Brené Brown stressed that the path to joy, love, and trust lies in vulnerability. Being vulnerable means being brave and being willing to show up and be seen when you have no control over the outcome. Each of us faces a choice between comfort and courage every day, and it’s about time we start choosing the latter in both our professional and personal lives. How? Don't say you're different—be different. Take a page out of Ben & Jerry's book and dare to be distinct.

Did you attend? Tell us your favorite takeaways in the comments.

Kirsten Clark is a Marketing Associate at CMB. She also had the privilege of seeing the hysterical (no, really, there were tears) Amy Schumer at INBOUND. (Amy, if you’re reading this, please consider being my friend. I make excellent guacamole.)

Topics: Storytelling, Marketing Strategy, Social Media, Brand Health & Positioning, Conference Insights

A Thousand Words: Using Graphics in Research

Posted by Betsy Herrick

Wed, Jul 01, 2015


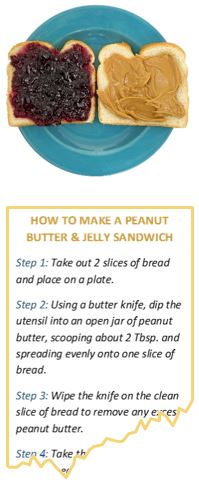
Hcmb, betsy herrick, data visualizationow do you make a peanut butter and jelly sandwich? It’s a simple task, but using only words to explain the process makes it seem far more complex. Images are easier to interpret and comprehend quickly. Show an image of a PB&J, rather than detailed instructions, to a sandwich-making rookie, and you’ll get your sandwich a lot quicker.The human brain processes visual images 60,000 times faster than any other type of stimuli. The use of images is a powerful and efficient tool to help convey your message. In today’s digital world, not only are people using visual communication more than ever, they’re also communicating better.

Using visuals enables your audience to see the meaning behind complex or large amounts of information by breaking it down into digestible pieces, simplifying the communication process and enhancing comprehension. Graphics can demonstrate hard to understand information and increase recollection and retention of information. In fact, information presented visually is six times more likely to be remembered days later versus information presented orally.

Although visual communication alone is shown to be more impactful than purely textual communication, the most effective method combines both types of content since visual communication is sometimes ambiguous and needs clarification. According to a study by Robert E. Horn back in 2001, combining visuals and text enhances comprehension by as much as 89%.

We approach deliverables with this in mind, and since there are a variety of visual techniques that can draw out (pun intended) the story behind the numbers, we often have to decide on the best route. For example, simple charts can enhance comprehension
of data, and by adding color coding, iconography, and other graphic elements, a higher level of detail can be revealed. The data becomes more organized throughout by displaying structure and visually mapping relationships within the research results.

deliverables   betsy blogSome visual methods are designed for impact, and are more likely to be remembered and shared, which is something to keep in mind when considering socialization within an organization. Using an infographic or interactive presentation to report results is 30 times more likely to be read and absorbed than plain text. These powerful mediums can convey meaningful results faster and more effectively than a data-heavy report. They strike an attractive balance between content types while telling a compelling and relevant story. Infographics, in particular, can be very engaging, and their versatility makes them a value-add for any industry’s research results.

No matter what medium you use, insights are only valuable if they are provided in a way that makes them easy to implement. So whether you use video, posters, dynamic presentations, infographics or plain old PowerPoint, make sure you keep them clear, concise, and easy to understand by your audience.  

Betsy is CMB’s Graphic Design Specialist and has been in the market research industry for over 15 years. At work, she enjoys turning ugly ducklings into swans…and speaking of ducks, she lives on a 30-acre farm in rural Maine with her husband and once had a duck named Monty that thought he was a cow. 

Watch our recent webinar with Research Now to hear the results of our recent self-funded Consumer Pulse study that leveraged passive mobile behavioral data and survey data simultaneously to reveal insights into the current Mobile Wallet industry in the US.

Watch Here!

Topics: Chadwick Martin Bailey, Storytelling

Reaping the Rewards of Big Data

Posted by Heather Magaw

Thu, Apr 09, 2015

HiResIt’s both an exciting and challenging time to be a researcher. Exciting because we can collect data at speeds our predecessors could only dream about and challenging because we must help our partners stay nimble enough to really benefit from this data deluge. So, how do we help our clients reap the rewards of Big Data without drowning in it? Start with the end in mind: If you’re a CMB client, you know that we start every engagement with the end in mind before a single question is ever written. First, we ask what business decisions the research will help answer. Once we have those, we begin to identify what information is necessary to support those decisions. This keeps us focused and informs everything from questionnaire design to implementation.

Leverage behavioral and attitudinal data: While business intelligence (BI) teams have access to mountains of transactional, financial, and performance data, they often lack insight into what drives customer behavior, which is a critical element of understanding the full picture. BI teams are garnering more and more organizational respect due to data access and speed of analysis, yet market research departments (and their partners like CMB) are the ones bringing the voice of the customer to life and answering the “why?” questions.

Tell a compelling story: One of the biggest challenges of having “too much” data is that data from disparate sources can provide conflicting information, but time-starved decision makers don't have time to sort through all of it in great detail. In a world in which data is everywhere, the ability to take insights beyond a bar chart and bring it to life is critical. It’s why we spend a lot of time honing our storytelling skills and not just our analytic chops. We know that multiple data sources must be analyzed from different angles and through multiple lenses to provide both a full picture and one that can be acted upon.

Big Data is ripe with potential. Enterprise-level integration of information has the power to change the game for businesses of all sizes, but data alone isn’t enough. The keen ability to ask the right questions and tell a holistic story based on the results gives our clients the confidence to make those difficult investment decisions. 2014 was the year of giving Big Data a seat at the table, but for the rest of 2015, market researchers need to make sure their seat is also reserved so that we can continue to give decision makers the real story of the ever-changing business landscape.

Heather is the VP of Client Services, and she admits to becoming stymied by analysis paralyses when too much data is available. She confesses that she resorts to selecting restaurants and vacation destinations based solely on verbal recommendations from friends who take the time to tell a compelling story instead of slogging through an over-abundance of online reviews. 

Topics: Big Data, Storytelling, Business Decisions

Are You There, News? It's Me, Snapchat.

Posted by Blair Bailey

Tue, Feb 24, 2015

snapchat, discoverSitting in my cozy Boston office, sipping coffee, I’m suddenly transported to Washington State’s Cascade Mountain Range, soaring above the mile-high Cowboy Mountain and scanning Tunnel Creek, a popular, snow-powdered trail and the site of the tragic 2012 Stevens Pass avalanche.This is the genius of the graphics that accompany “Snow Fall: The Avalanche in Tunnel Creek,” a story that debuted in 2012 on The New York Times’ online edition. Although the rushing show and biting winds are only graphics embedded within the article, they are so well done you feel like you are there. In recent years, The New York Times, a stalwart of traditional print news, has dominated digital storytelling, integrating stunning and sometimes interactive graphics within its pages.

As beautiful as these features are (and they are still stunning 3 years later), where does this interactive, visual storytelling fit within our 140-character, 6-second-film, top-8 lives? (Forgive the MySpace reference, but nothing conveys digital restrictions more than fitting your most prized friendships into a 2 x 4 grid.)

Snapchat, an app notorious for its not-so-lasting impressions, recently released Discover, allowing traditional media companies to feature public content, like trailers and current events, within the app. The media outlets range from Cosmopolitan to National Geographic and tease users with graphics and sound bites as well as the traditional flashy headlines. After hitting the purple dot in the upper right corner, users are presented with an array of publications to choose from. Once a publication is selected, users can swipe left and right to move through stories, swipe up to read more, or swipe down to exit the publication and return to the Discover menu.

By now, most publications have a mobile presence of some type. So, why is Snapchat’s most recent move something we should care about? Although it’s not an entirely novel idea, Snapchat’s new feature adds several unique twists to digital storytelling.

  • In keeping with Snapchat’s ephemerality, Discover’s content is only available for twenty-four hours. While the content can be viewed as many times as desired during that period, the news outlet invites users to come back tomorrow for new stories.
  • Unlike Facebook and Twitter, both of which typically lead the user away from the platform, all Discover content—articles, videos, photo sets, trailers, music videos, etc.—is contained within the app.
  • Snapchat also serves a very different demographic than most social media sites. Discover is targeted to Millennials, but, as of July 2014, over 50% of Snapchat users are between 13-17 years old and over 80% are under 24 years old. Many of the publications on Discover may be taking an initial risk straying so far from their key audiences .
  • Discover is also a fresh idea to existing Snapchat users. Unlike Twitter, where incoming brands have to adhere to the existing 140-character boundaries, Discover breaks the Snapchat mold without straying too far from its original purpose. The format is different enough to interest users and keep them coming back, but still familiar enough that users recognize the Snapchat interface.

While the selection of publications could be tweaked further, Discover shows that Snapchat knows its users. Short, (mostly) teenage attention spans still get their familiar bite-size content but in a format that’s new enough to hold their attention. Discover also holds the potential to keep Millennials coming back for more than momentary embarrassing videos and wacky photos. It adds value to an app that has seen a lot more selfies than the average person could probably handle.

With over 1.2 billion websites cluttering our networks, storytelling has become increasingly important to stand out among the dot nets and dot coms. And it’s not just apps and news sites. In data heavy fields like market research, it can be easy to let storytelling take a backseat. That’s why we’re investing more time and resources into creating dynamic storytelling through infographics, video, and mobile. This engaging, inspiring, and motivating content brings results to life and helps us strengthen the relationship between our clients and their audiences. . .and best of all, we do it without all those selfies.

Blair Bailey is an Associate Researcher at CMB and a recent M.S. graduate from Boston University. When she isn’t working with data or being held captive by the commuter rail, you can find her carefully flooding her social media feeds with pictures of dogs.

Topics: Mobile, Storytelling, Social Media