To Infinity and Beyond: Why Going the Extra Mile Pays Off

Posted by Hannah Jeton

Fri, Jul 10, 2015

cmb, questionnaire design, research with kidsCMB’s portfolio is pretty expansive: we do research in a variety of industries and work with many different types of consumers—from insurance consumers to techies to medical experts to small business owners. We know how to get answers, and, more importantly, we are experts in getting to know our audiences. We learn more every day from our work, and we’re always willing to go above and beyond for our clients.I recently worked on a project with a kids’ media company that struck me as new, exciting, and something that I thought I would never come across unless I worked at a boutique kids-only research firm—I couldn’t wait to dive in! Our client wanted to understand kids today and segment the market beyond age and gender. The design, methodology, and project planning came naturally. However, when we reviewed the wording of the questionnaire, we knew we would have to step into our “kid” shoes and adjust accordingly.

Our approach to capture the appropriate wording and diction was twofold. First, we did a series of in-depth interviews, which uncovered ways to speak to various types of kids—leaving no child behind. (For example, we learned that there’s a group of kids out there who wish that they had a superpower of being able to shoot flames out of their backsides—please note this was selected over being invisible, being able to fly, and other “more appropriate” powers). Upon completing the IDIs, we felt that we could make lists exhaustive and kid-friendly, so we moved forward and programmed the survey.

Our next step was to do a round of pre-testing the program we planned to field, so we programmed the survey and observed while kids and parents went through the survey together. This allowed us to see which questions worked, which ones didn’t, which ones we had to further “gamify,” which ones had responses that were too similar, and which ones were confusing to kids. A max difference exercise is just one example of how the pre-testing helped us. We ran a force choice task asking kids to select between 2 descriptors, such as smart v. pretty, popular v. famous, and pretty v. popular. As we watched our pre-testers go through this process, we overhead a common sentiment: “why can’t I be both?”—which was an indicator that the force choice exercises were not a great method to use when doing research with kids. Thus, this pre-testing further refined our design into a clear, fun, and strong program that both kids and parents had fun doing together.

You may be asking yourself: why go the extra mile? Well, because we knew it would pay off, and it did! These extra steps allowed us to create an extensive segmentation that moved far beyond age and gender (the average age across the 7 segments varied between 8.2 years old to 8.6 years old) and had an 85% classification rate on the typing tool. This project was unique and adorable, but it was also a wonderful learning opportunity. It emphasized the importance of getting to know your audience and also proved that upfront research with experts can go a long way when you go into the field.

Hannah is a Project Manager on the TEM team and considers herself closer to being a kid than to having one. Her superpower of choice is omnilingualism.

Watch our recent webinar with Research Now to hear the results of our recent self-funded Consumer Pulse study that leveraged passive mobile behavioral data and survey data simultaneously to reveal insights into the current Mobile Wallet industry in the US.

Watch Now!

Topics: Research Design, Research with Kids

A Thousand Words: Using Graphics in Research

Posted by Betsy Herrick

Wed, Jul 01, 2015


Hcmb, betsy herrick, data visualization
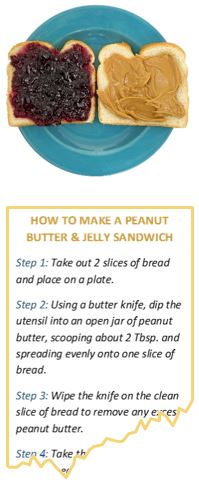
ow do you make a peanut butter and jelly sandwich? It’s a simple task, but using only words to explain the process makes it seem far more complex. Images are easier to interpret and comprehend quickly. Show an image of a PB&J, rather than detailed instructions, to a sandwich-making rookie, and you’ll get your sandwich a lot quicker.The human brain processes visual images 60,000 times faster than any other type of stimuli. The use of images is a powerful and efficient tool to help convey your message. In today’s digital world, not only are people using visual communication more than ever, they’re also communicating better.

Using visuals enables your audience to see the meaning behind complex or large amounts of information by breaking it down into digestible pieces, simplifying the communication process and enhancing comprehension. Graphics can demonstrate hard to understand information and increase recollection and retention of information. In fact, information presented visually is six times more likely to be remembered days later versus information presented orally.

Although visual communication alone is shown to be more impactful than purely textual communication, the most effective method combines both types of content since visual communication is sometimes ambiguous and needs clarification. According to a study by Robert E. Horn back in 2001, combining visuals and text enhances comprehension by as much as 89%.

We approach deliverables with this in mind, and since there are a variety of visual techniques that can draw out (pun intended) the story behind the numbers, we often have to decide on the best route. For example, simple charts can enhance comprehension
of data, and by adding color coding, iconography, and other graphic elements, a higher level of detail can be revealed. The data becomes more organized throughout by displaying structure and visually mapping relationships within the research results.

deliverables   betsy blogSome visual methods are designed for impact, and are more likely to be remembered and shared, which is something to keep in mind when considering socialization within an organization. Using an infographic or interactive presentation to report results is 30 times more likely to be read and absorbed than plain text. These powerful mediums can convey meaningful results faster and more effectively than a data-heavy report. They strike an attractive balance between content types while telling a compelling and relevant story. Infographics, in particular, can be very engaging, and their versatility makes them a value-add for any industry’s research results.

No matter what medium you use, insights are only valuable if they are provided in a way that makes them easy to implement. So whether you use video, posters, dynamic presentations, infographics or plain old PowerPoint, make sure you keep them clear, concise, and easy to understand by your audience.  

Betsy is CMB’s Graphic Design Specialist and has been in the market research industry for over 15 years. At work, she enjoys turning ugly ducklings into swans…and speaking of ducks, she lives on a 30-acre farm in rural Maine with her husband and once had a duck named Monty that thought he was a cow. 

Watch our recent webinar with Research Now to hear the results of our recent self-funded Consumer Pulse study that leveraged passive mobile behavioral data and survey data simultaneously to reveal insights into the current Mobile Wallet industry in the US.

Watch Here!

Topics: Chadwick Martin Bailey, Storytelling

Better Demographics = Better Insights

Posted by Eliza Novick

Thu, Jun 25, 2015

There is a strong belief that gender identity can be used to predict behavior in the marketplace, and we see evidence of this belief in advertising every day (and we also regularly poke fun at this idea - see the video below). Despite this, the standard approach to collecting information about gender and behavior often lacks the depth and complexity necessary to reach the meaningful insights around gender identity. How can we fix this? One way forward is to incorporate social science into our questionnaire design. 


There’s a large body of evidence from social science research that indicates social identities, like gender, can have concrete economic implications for people belonging to certain groups. Gender is not only an expression of individual identity, but is also negotiated on a group level as we practice and enforce patterns of hierarchical social, political, and economic relationships (including work and family life). So, while one woman’s social, political, and/or economic profiles may deviate from the profiles of women as a group, she’s still subject to the systematic opportunities and barriers that these group profiles represent.

At CMB, we often leverage social science in questionnaire design to elicit responses that most closely reflect the market. As an industry, we could (and should) go further in the way we collect demographic information. For example, respondents are typically allowed to select only one employment status from a list of several options: employed part time, employed full time, full time homemaker, full time student, retired, or unemployed. From the social science perspective, this question is problematic because it ignores the fact that respondents may fall into more than one category and that women are more likely than men to experience overlap in these categories in their lifetime. A question like this might produce compromised data, particularly for respondents who are young, female, and/or low-income. Another example is marital status: is the marketplace behavior of a same-sex unmarried couple categorically different than that of a couple in a traditional marriage? Depending on the industry, the answer may vary, but with a few easy questionnaire tweaks, we can capture that information.

From segmentation to optimization, demographic information is often a critical part of the analyses that solve our clients’ business challenges. But our answers to their problems are only as good as the questions our surveys are asking. Revisiting demographic collection is an easy update that goes a long way towards generating higher quality data, making better evidence-based recommendations, and pushing businesses forward.  

Eliza Novick is an Associate Researcher at CMB. Her favorite Boston attraction is the New England Aquarium, particularly the Edge of the Sea exhibit where you can pick up clams and starfish. 

Want to know the latest on barriers and opportunities for the next generation of mobile payment providers?

DOWNLOAD THE FREE REPORT

Topics: Data Collection, Research Design

A Rose by Any Other Name Might Smell Sweeter

Posted by McKenzie Mann

Tue, Jun 23, 2015

amazon mom, family, segmentationSince the death of popular dad-blogger Oren Miller in February, there has been a resurgence of an initiative he started: pushing Amazon to change its parenting program’s name from “Amazon Mom” to “Amazon Family.” Amazon Mom is a subscription-based service that allows parents to get deals such as 20% off diaper subscriptions and 15% baby registries. Members also receive emails with messages like “As a busy mom, your time is precious. That’s why we’re offering you two free audiobooks—so you can catch up on today’s best sellers even when you’re on the treadmill, in yoga class, or toning up.” It’s apparent from its name and its messaging that Amazon has chosen a target market for this service, and it is not Oren Miller.However, in other countries, Miller wouldn’t have had to start this initiative. Elsewhere in the world (CanadaFrance, AustriaJapanGermany, and the U.K.), Amazon Mom is already known as Amazon Family. The sites all look similar and offer similar discounts, so why is the name different in the U.S.? While Amazon has not made any comments on this, it is clear that they thought naming the program Amazon Mom would be more successful for the brand in the U.S. marketplace. This one word change has an immense effect on who might use the program. As Miller frequently pointed out on his blog, the name insinuates that mothers are the only capable caretakers and, thus, the only ones who would use this service.

Why would Amazon do this? Probably because even though using the word “mom” instead of “family” ostracizes an entire group of people, it allows Amazon to directly appeal to this service’s primary target market: moms. This is a situation in which a segmentation study could have come in handy. Although sometimes the markets for services or products seem obvious, segmentation studies can identify underlying groups that might otherwise be missed. It can use goals, experience, usage, characteristics, and needs to group similar people together in ways that might not be obvious at first. In this case, a segmentation could show that Amazon was missing a smaller—but vocal—group in dads.

Miller’s petition is nearing its goal amount of signatures. If it hits its goal, will it make a difference? Will “Amazon Mom” actually change to “Amazon Family”? Possibly. It’s at least something to consider as more and more people get involved in the cause, using #AmazonFamilyUS to shine light on the situation and to illustrate how angry they are at being excluded.

McKenzie Mann is a Senior Associate Researcher at CMB. She spends most of her spare time trying to convince her friends that it’s funny to replace the word “man” with “mann.” It's a work in progress, but mann will it be great when it catches on.

Topics: Brand Health & Positioning, Market Strategy & Segmentation, Retail

New Study: How Wearables Will Drive the Mobile Wallet Revolution

Posted by Abe Vinjamuri

Tue, Jun 16, 2015

Mobile2015IconEvery year we hear bold new predictions about mobile wallet, and every year those predictions fall flat. So, with some trepidation, we ask: is this the year when mobile payments finally take off?A lot of pieces of the puzzle are finally in place:

  • NFC and tokenization have been accepted as the standard for payment tech (QR is fighting a losing battle although some heavyweights still back it)

  • Networks (Visa, MasterCard etc.) have managed to co-opt the mobile revolution and avoid the threat of disruption

  • Credit card providers see the opportunity to drive growth

  • EMV (chip and PIN) standards have forced retailers to upgrade payment terminals which now are NFC enabled

  • Mobile service providers have given up their bid to control the payments business

  • And most importantly, consumers are increasingly comfortable with the idea of using smartphones to pay for purchases-they are at a similar point in the adoption curve as they were with online payments a decade and half ago

So, yes, mobile payments will grow in the next 12-18 months. And smartphones will continue to drive that growth.  But the big news is that mobile wallets are poised to get a major boost from the proliferation of wearables. In our latest Consumer Pulse study, we surveyed nearly 2,000 smartphone owners about mobile wallets and wearables awareness and habits. Here are a few of the key takeaways:

You want to put that chip where?

Formerly confined to fitness trackers, and to some extent smartwatches, wearables are still emerging for the average consumer. Currently, about 60% of the market is at least somewhat familiar with wearables in the generic sense. And with the pace of technology, this is a low barrier.  A new product that fulfills a need (perceived or not) can gain attention in the flash of a Snapchat.

As the wearables category broadens to include trackers, shirts, bands and other devices that are an extension of the wearer, mobile payments are a natural offshoot. In fact, beyond table stakes (battery life, pedometers etc.) 40% of likely wearable buyers want built-in mobile wallet functionality. Our data shows that wearable and mobile wallet adoption is symbiotic in nature. A majority of those looking to buy wearables say having mobile wallet functionality would bring them closer to the purchase decision. And a similar majority say they would use mobile wallets a lot more if it were a part of their wearable functionality. Looks like a win-win.

Good news for smartphone makers

Although at present wearables are primarily associated with fitness trackers (smartwatches are perceived a bit differently though that line is blurring really fast); many see wearables as an extension of the smartphone category – and expect smartphone brands to lead the wearables march. While the top players are as expected: Apple and Samsung, the door is still wide open for a variety of players like Google, Microsoft, Fitbit, Sony, Nike, and LG.  And perhaps the best news is that, in general, buyers expect highly functional wearables to cost between $175- $275. Of course, there are always those who are willing to splurge north of $400.

What about payment companies?

In all this excitement around wearables and mobile payments we can’t forget the critical role of payment companies. As mentioned previously, networks and credit card companies have a critical role to play. At the moment, usage data indicates two things: one, usage of credit cards in a mobile first world mimic that in the physical world – card usage behavior (primary card, share of wallet) has not changed. Two, checking accounts, debit cards, PayPal have a large presence on mobile wallets. We continue to maintain that mobile payments present an opportunity to shake up some of the existing stalemates in the industry and at present it seems like no single player has a decisive advantage.

What does all this mean?

Depending on how narrow or widely mobile payments are defined, the trillion+ dollar industry is fluid at the moment, with everyone trying to get a large piece of the pie. From a purely consumer-centric perspective, the barriers are lifting, the options are expanding and before you know it a majority of consumers will have access to mobile wallets through smartphones or wearables. The key to winning them over will be to make the experience natural and seamless. The day someone can put together an experience where my jogging shirt tells me to run faster between miles 5 and 7 and then pays for my smoothie is the day wearables would truly achieve their potential. I’m betting that the day is not far away.

Abe is a payment-tech and ecommerce Project Lead, Strategist, and CrossFit enthusiast.

DOWNLOAD THE FREE REPORT

Topics: Technology, Financial Services Research, Mobile, Consumer Pulse, Retail